vMaps Support
editable maps for PowerPointCreate a Heat Map
vMaps provides an easy way to re-color your vMap using Excel data to create heat maps.
How to use the Heatmap feature
The video tutorial below shows how the feature is used and these are the basic steps:
- Insert a map that has more than one shape in it eg. the World map (these instructions show you how)
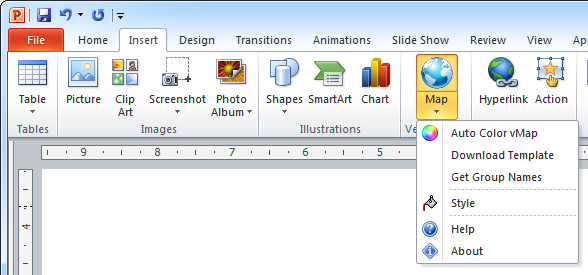
- Click the bottom part of the vMaps button in the Insert tab of your PowerPoint ribbon
- Select Download Template and save the Excel file to your computer
- Open the downloaded Excel file and find the sheet for your map
- Change the RGB columns to the required colors if you’re using the RGB color mode or set the Data Value column to the data of your choice if using the Color Scale mode.
- Click the Create Heatmap button
- Click Browse to locate your Excel data file
- Click the down arrow of the Sheet drop-down box or the Refresh button to get the list of sheets from the Excel workbook
- Select the correct sheet for your map
- Choose the color mode between Color Values from Excel File or Color Scale
- If you use Color Scale, click each of the Minimum and Maximum colors to set them
- Click the Color Map button
Video Tutorial
In the tutorial below, we show you how to use the Heatmap feature and its two color modes.