vMaps Support
editable maps for PowerPointUsing Get Group Names for Heatmap use

Got one of your own maps?
All of the maps within the vMaps add-in are pre-named and correspond to the free downloadable Excel template that is used for the Heatmap feature.
If you want to use Auto Color for a map (or any other group of shapes) that you have sourced outside of vMaps, you can do this by following the steps below.
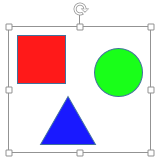
- Add your map to a slide. In this example, we’re using some standard PowerPoint shapes to represent the regions of a country for simplicity:
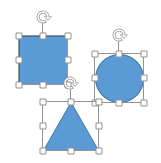
- Make sure that all shapes are named (press Alt+F10 in PowerPoint 2013/2010):
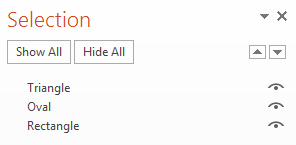
- We have renamed ours to keep the example clean:
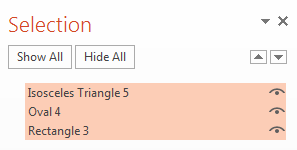
- Group all of the shapes. Note that it doesn’t matter if you have nested groups of groups. Auto Color just needs one group (with any name) to process:

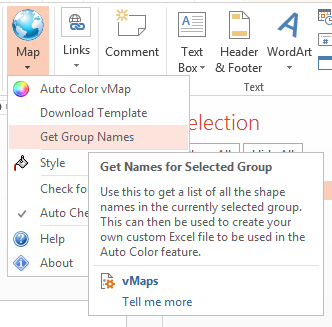
- With your group selected, click the Insert tab in the PowerPoint ribbon and click the Map drop down button followed by Get Group Names:
- This creates a text shape on your slide containing the names of all shapes within the group:

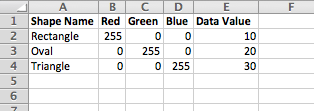
- Start Excel and copy/paste the shape names from PowerPoint to create an Excel file containing data as per the example below. Pay careful attention to the exact naming of the first header row: (we’ve specified pure red, green and blue for each of our three shapes)
- Auto Color supports two modes, coloring by absolute Red/Green/Blue (RGB) color and an automatic scale mode which uses a Data Value in your sheet. For the manual mode, columns B:D specify the RGB fill colour (within the range of 0-255 for each) for each of the named shapes. The automatic mode uses column E and calculates the scale from the min and max values detected in the column and then uses each row’s Data Value to work out a colour based on the min/max colours you choose in AutoColor (see #13 below).
- Back in PowerPoint, with your map group still selected, click the Map drop down button again and click Auto Color.
- Click Browse to your select your newly created Excel file.
- Click Refresh.
- Select your desired Sheet.
- Choose the Color Method you want to use (refer to #8 above) and select the min/max colours if using the automatic color scale mode:
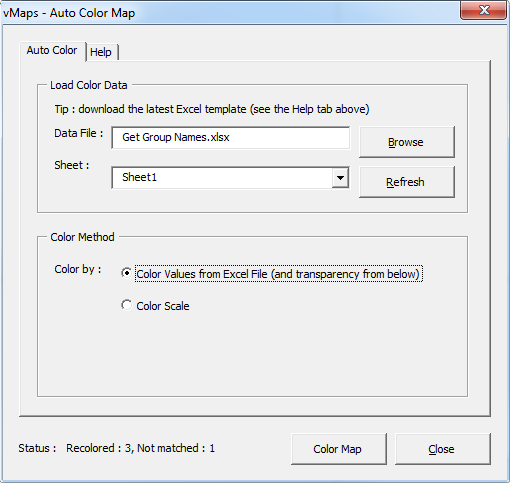
- Click the Color Map button and all matching shapes in the group are recolored according to the chosen method and Excel data: